Graph problem

Hi,
Something weird is happening with the graphs.
I have 8 HVAC zones with an analog log for set temperatura and another one for room temperature each. Well, I've added to the visualization a data logger (opengraph button) for every zone and added to it the 2 analog logs.
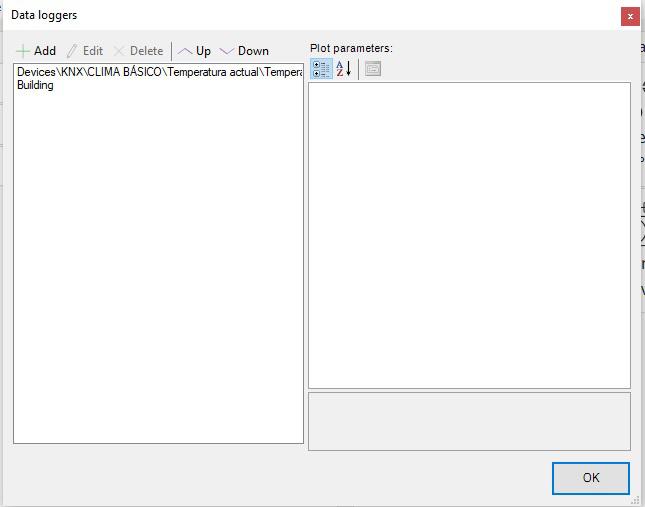
Everything was fine with the first 6 zones. 7th and 8th zones only work fine if I add to the graph only one log. If i add a second log to it, a error shows when I try to open the graph in the visualization. Then I open the graph in the config and one of the two logs is missing, showing the first one and another one with the "Building" node (see image attached).
Is this only happening to me?
Thanks in advance.
Best regards,

Hello,
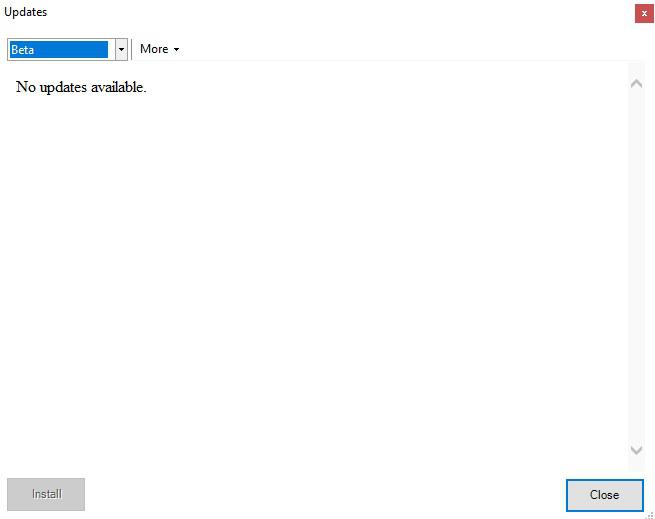
try updating to the latest BETA version where this problem has already been fixed.
Best regards.