Grpah scale padded

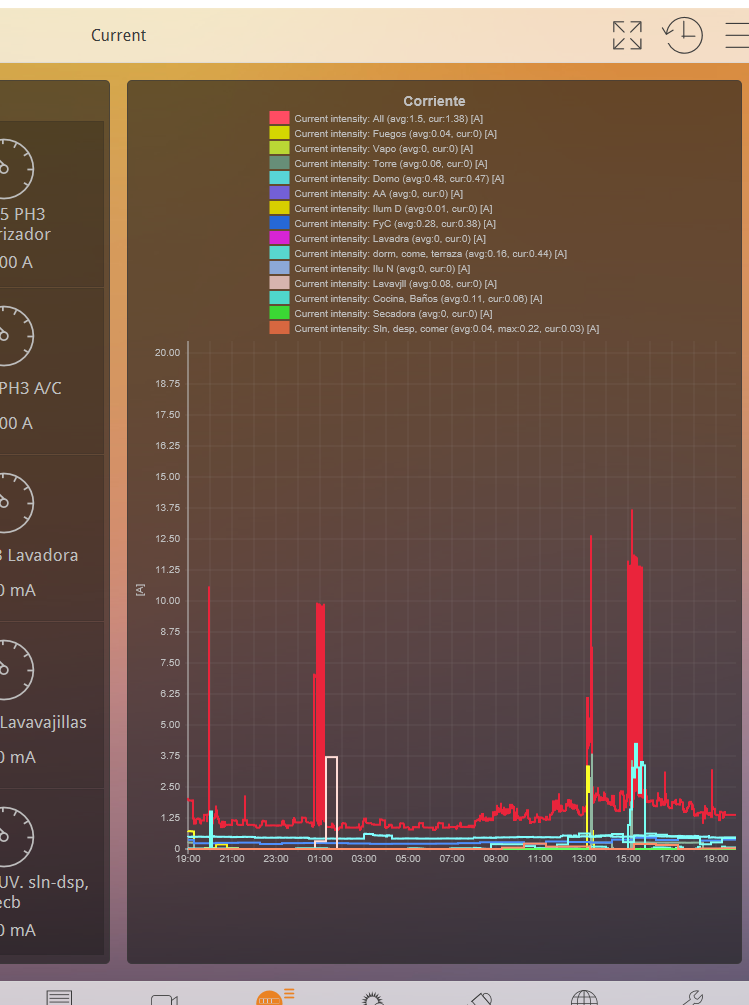
Anyone knows why the graph scales more than required? For example in the image attached, the maximum value achieved on the Y axis for the current is about 13 A, however BOS chooses to scale the graph with a maximum of 20 on the Y axis.
Tbh, even is the number on the Y axis was 5, the graph would still show 20 as the max, hence losing all ability to read the values.
Any thoughts? there is no way to change any property to create such padding space!

Hello,
could please send us back up to our support email: support@comfortclick.com
Select log and click on Backup button.
Best regards