Analog Graph - Scalling question

Hello,
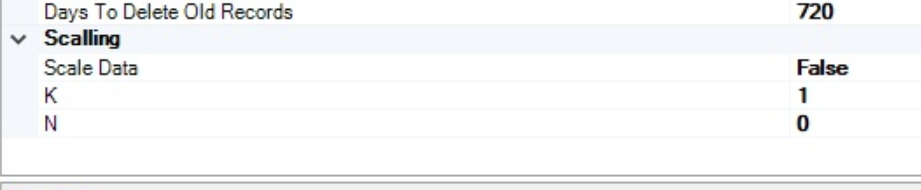
In analog graphs, it is possible to scale data.
Since I have never needed to do this, I haven't looked into the details until now, but while trying to improve my setup, I discovered that it could be useful. However, I don't understand and (despite my research) haven't been able to figure out what the two options “K” and “N” mean and how to use them...
Anyone to bring me some light ?
Thanks,


IMHO It would be important to note here that these K and N factors are used before recording data, and the graph is only related in the sense that it displays the same recorded data. However, would it be possible to include the same K and N factors when plotting the graph, which would, for example, modify the raw data during the graph drawing?
Alternatively, if recalculating the data during graph plotting would create an unnecessary load on the system and also require solving the issue of storing newly calculated data, perhaps it could be possible to add the ability to perform recalculations on already recorded data via the configurator. For instance, a certain 0/1 value might have been logged for some time and stored as such, but later there arises a need to display it on the graph as 0/10. Currently, this can only be done using third-party software, where the data must first be exported from the bOS, then modified in another program, and finally imported back into bOS.