Analog Graph - Scalling question

Hello,
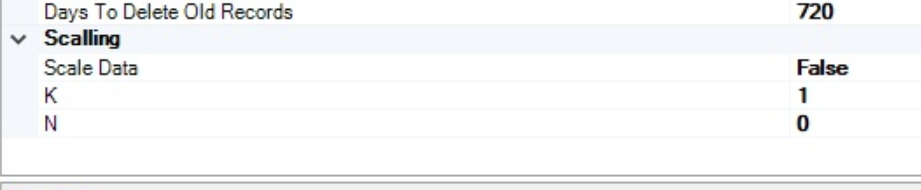
In analog graphs, it is possible to scale data.
Since I have never needed to do this, I haven't looked into the details until now, but while trying to improve my setup, I discovered that it could be useful. However, I don't understand and (despite my research) haven't been able to figure out what the two options “K” and “N” mean and how to use them...
Anyone to bring me some light ?
Thanks,


I haven't needed it either yet. And the manual is somewhat unclear what these K and N values actually do or how to calculate them. Here is a little explanation.
In the equation Y = KX + N, K is the slope or rate of change (how much Y changes for each unit increase in X), and N is the Y-intercept or the vertical shift (the value of Y when X is zero). Together, K and N determine the specific linear relationship between the variables X and Y, with K dictating the steepness of the line and N controlling its vertical position on a graph. Understanding K (Slope/Rate of Change)
Understanding N (Y-intercept/Vertical Shift)
Example
Temperature probe: Analog Log-scale.bos
Raw: 0 – 1023 counts ↔ scale to: 0 – 100 °C
K = (100 – 0) / (1023 – 0) = 0.0977 (°C per raw count)
N = 0 – 0.0977 × 0 = 0
So if your sensor is sending out values temperature values as0-1023 then the analog log will scale its value to 0-100 range.
If instead the sensor is 0.1 V → 0 °C, 0.4 V → 100 °C, and the PLC turns 0.1 V into 512 counts, 0.4 V into 2048 counts:
K = (100 – 0) / (2048 – 512) = 0.0769
N = 0 – 0.0769 × 512 = –39.4 (≈ –39)