Graphic spikes when bOS makes a backup

Hey clickers,
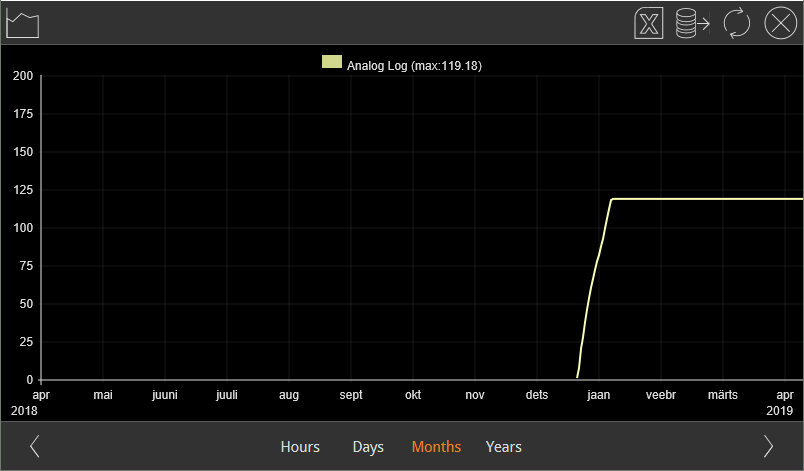
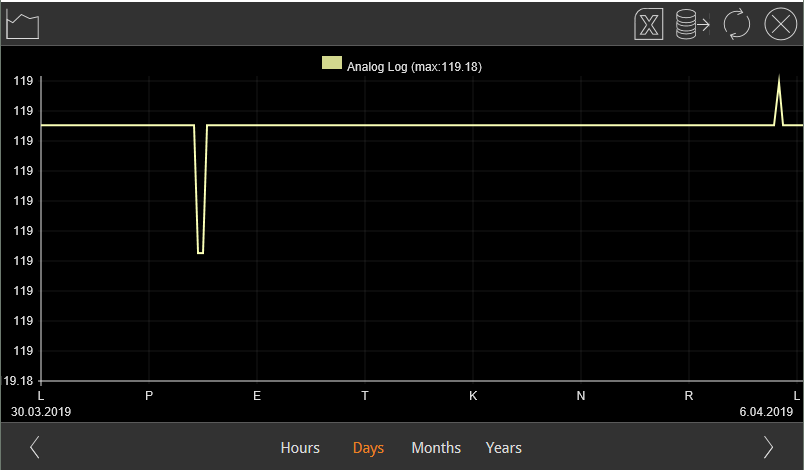
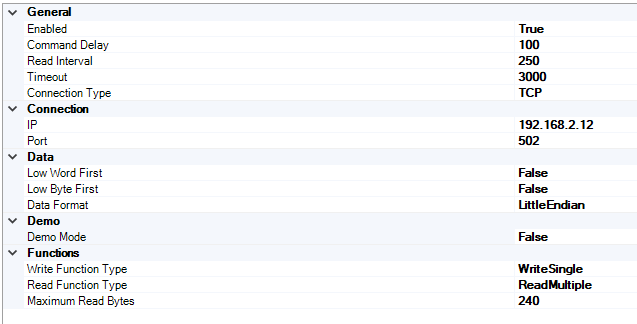
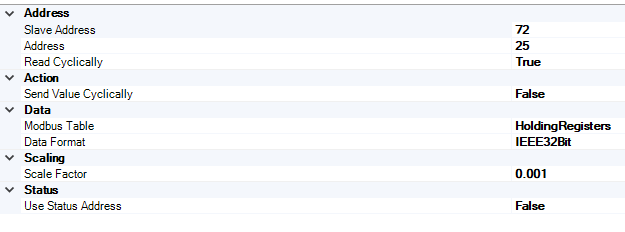
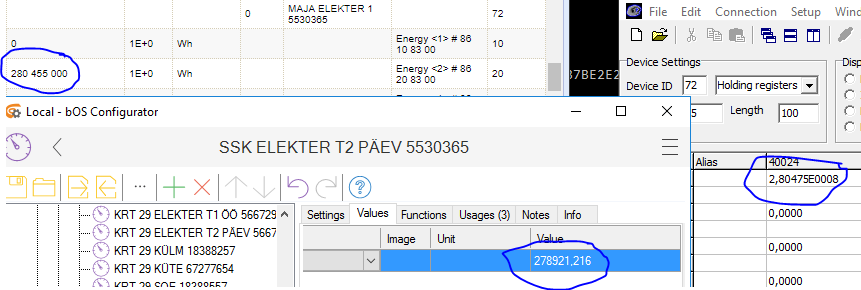
I'm having a weird problem again, Our client demanded graphics for every meter (C/H water, electricity and for the whole building ventilation system) and i noticed that when we did a backup of the bOS configuration or the server did a restart, we got weird spikes in graphics that sometimes where lower values and some were higher values. The water and electricity info is collected and readout by Anybus mbus to modbus and the ventilation values are collected with usb modbus dongle. Pic below has a week view but actually the value rises again after the server get the correct value again from Anybus.


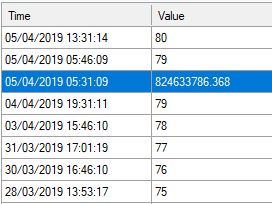
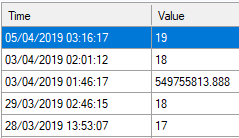
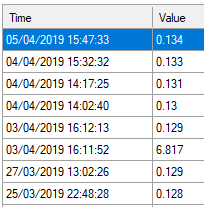
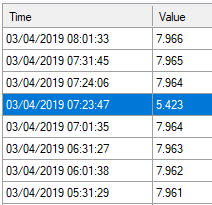
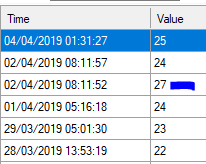
The thing is that I've been watching the raw logs from Anybus and these spikes don't come from Anybus... And when i look at the database files I see that right after the bOS server comes up it writes a unknown value and 15minutes(thats the update time of Anybus) later it will update it to the correct one. How to get rid of them spikes and where to they come from? And as you see from the picture the spikes are random not every meter is affected by it. I now have corrected the value spikes manually.

Hey,
I sent a email with the config and access info.
i forgot to add info about the last spikes i noticed:
Anybus maja 1:
Krt 10 Soe
Krt 11 Soe
Anybus maja 2
Krt 16 Soe
Anybus maja 3:
Krt 32 Küte
Krt 35 Elekter both night and day
Krt 37 elekter both night and day
Krt 38 Elekter night
Anybus maja 4:
Krt 44 Soe
Krt 46 Küte
Best regards
Jürgen