Graphic spikes when bOS makes a backup

Avatar
  • updated
  • Under review

Hey clickers,

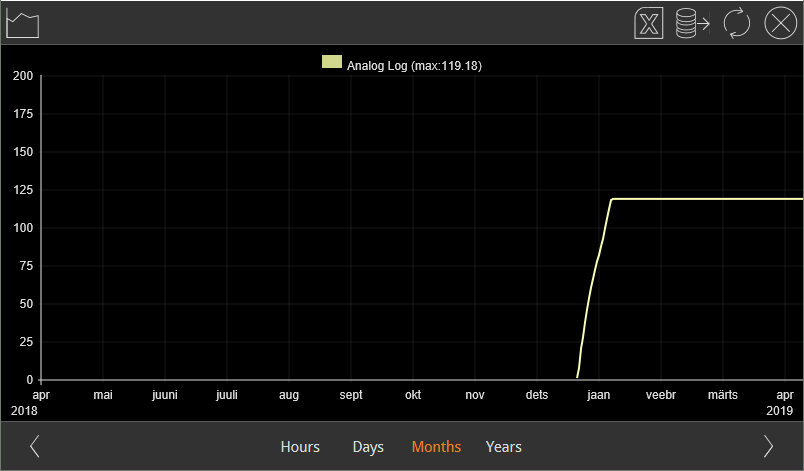
I'm having a weird problem again, Our client demanded graphics for every meter (C/H water, electricity and for the whole building ventilation system) and i noticed that when we did a backup of the bOS configuration or the server did a restart, we got weird spikes in graphics that sometimes where lower values and some were higher values. The water and electricity info is collected and readout by Anybus mbus to modbus and the ventilation values are collected with usb modbus dongle. Pic below has a week view but actually the value rises again after the server get the correct value again from Anybus.

Lower value spike, goes back to normal after 15min.

Higher value spike, goes back to normal after 15min

The thing is that I've been watching the raw logs from Anybus and these spikes don't come from Anybus... And when i look at the database files I see that right after the bOS server comes up it writes a unknown value and 15minutes(thats the update time of Anybus) later it will update it to the correct one. How to get rid of them spikes and where to they come from? And as you see from the picture the spikes are random not every meter is affected by it. I now have corrected the value spikes manually.

Avatar
Jürgen Jürgenson

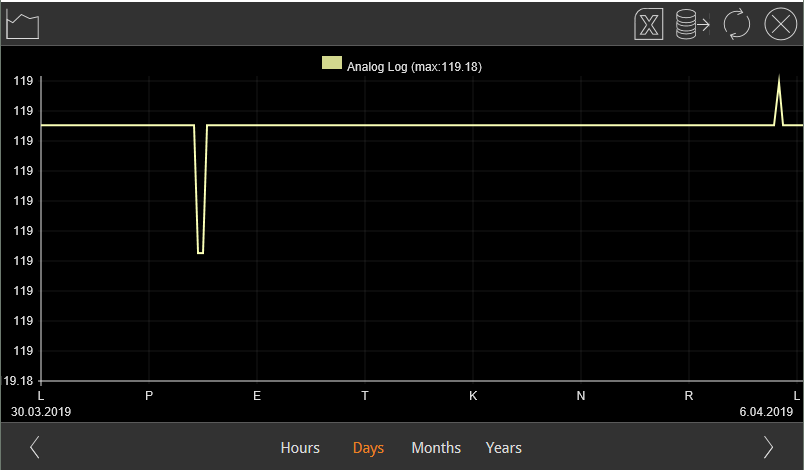
So hey its me again and sadly it happened again.

It happened to ~10 meters most of the spikes happened on 3.04.19

I did fix all the graphics on 2.03.19 so day after the fix they returned... The server has been online all this time, no restart no backups after 2.03.19. 

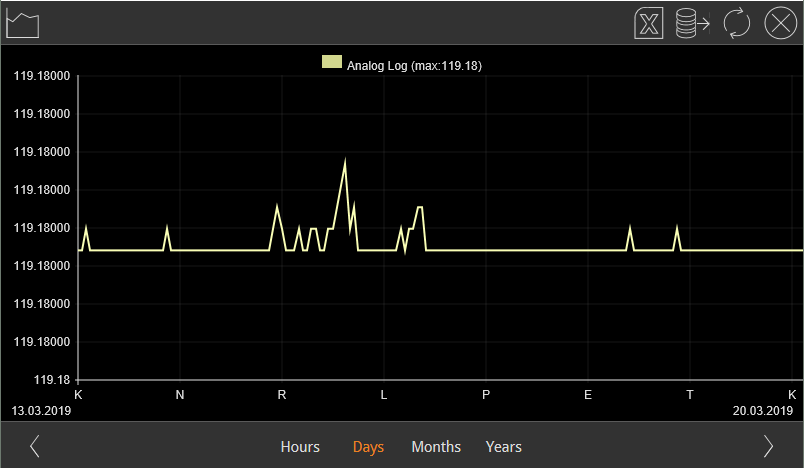
Apartment 37 el.day t2

Apartment 37 el.day t1

Same apartment but the value spike is on 5:31 and 1:46. Returns to normal.


Some more examples 

Apartment 10 hot w

Apartment 32 heating

Apartment 38 el.night


I will leave the DB's as is right now. And will check next week if there's any new spikes.

Avatar
ComfortClick Support

Hello,

there could be an issue with anybus as well, maybe bOS receives this values and displays it from there. Are there any logs available in anybus as well so we can check if these spikes happen there as well?

Best regards.

Avatar
Jürgen Jürgenson

Yep I have the raw log active in anybus, also I have sent these log to anybus support so they can check them, they told me that the logs look ok. 
Here are the raw logs for building 3 for 3.04.19 and 4.04.19 on that day there were most spikes. example 03.04.19 4:11:52 address 24 and 14 on slave 13
MBUS_20190404.log
MBUS_20190403.log


I personally don't know how to convert this raw log for humans to read.

Avatar
Jürgen Jürgenson

Same spikes happens for fibaro plug at my home server, otherwise it updates the values correctly and you can't see the spikes in the graphics log nor in the months view, but if you select days view you can see them.

Example month view looks fine

Days view

Here is the log itself and it looks correct to me, no spikes in the numbers, but the graph still has them.Analog Log.db

Edit: only difference i see is that with the fibaro plug i cant see the spikes in hour view, but with anybus/mbus meters i can see the spikes in log and with hour view.

Avatar
ComfortClick Support

Hello,

could you please send the configuration (where you have modbus issues with spikes) to david.boben@comfortclick.com and we'll take a closer look again at the issue. Later we can also schedule a live access to the live configuration again and check everything with our dev team.

Best regards,

Avatar
Jürgen Jürgenson

Hey,

I sent a email with the config and access info.

i forgot to add info about the last spikes i noticed:

Anybus maja 1:

Krt 10 Soe

Krt 11 Soe

Anybus maja 2

Krt 16 Soe

Anybus maja 3:

Krt 32 Küte

Krt 35 Elekter both night and day

Krt 37 elekter both night and day

Krt 38 Elekter night

Anybus maja 4:

Krt 44 Soe

Krt 46 Küte

Best regards

Jürgen